Get in touch
hello@stymix.com

Thinking about diving into the world of A/B testing? Then, you're on the right track to making data-driven decisions for your business. Although you can conduct A/B testing for literally any part of your business; it is very, if not the most, common to A/B test your website design or app components.
However, for a successful test you must find the right metrics to evaluate your results. Otherwise, it will be challenging to analyze A/B test results. This article explores some of the most useful A/B testing metrics.
A metric framework is a structured approach to choosing and using metrics. It helps you identify the most important metrics to track based on your goals.
You need a solid framework to measure your results. These metrics help you understand what changes positively impact you and which ones might not be hitting the mark.
The right metrics align with your business goals and help you optimize your conversion rates. With so many possible metrics to track, a framework keeps you focused on the most important ones.
Primary Metrics: These are the main metrics you're focusing on to evaluate performance. For example, if your goal is to increase sales, your primary metric might be the conversion rate.
Secondary Metrics: These metrics provide additional context for primary metrics. They can help you understand your primary metrics and support their behavior. If we take the previous instance of conversion rate, then we can check add to cart rate. It should increase with increasing conversion rate or decrease if conversion rate is declining.
Diagnostic Metrics: These metrics help you diagnose issues or challenges of the primary and secondary metrics, explains why those metrics are going up or down. Say you added a new feature to get higher conversion rate. However, this has impacted your page speed. This cannot be detected by considering conversion rate for the test only. In this case if bounce rate increases, you can understand as to why the primary metric is not increasing.
However, whatever your goal may be there are some common A/B testing metrics that most business needs to track to properly analyze the results. Here's our list of 10 common A/B testing metrics.
Let's go into the details.
Conversion rate is the king of A/B testing metrics. It measures the percentage of users/visitors who make a desired action, like purchasing or signing up.
For instance, you test two landing page versions to see which one gets more sign-ups. Version A has a sign-up form at the bottom, while version B has one at the top. After running the test, you want to select whichever version has the higher conversion rate.
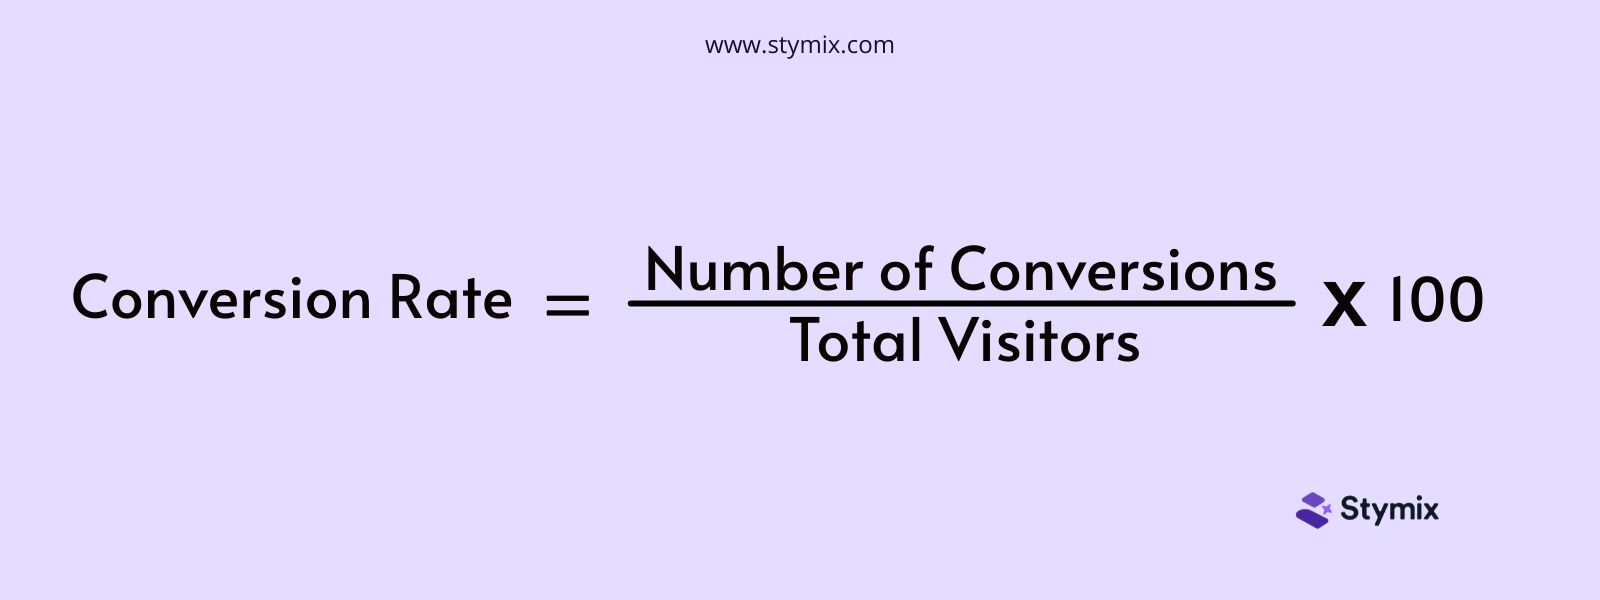
Conversion rate optimization is very important for your site. And tracking your it is much easier as well.
Conversion Rate = (Number of Conversions/Total Visitors) x 100
All we need to do here is determine what constitutes a conversion. It could be a sign-up, a sale, or a demo request. For example, if 500 out of 10,000 visitors sign up for a newsletter, then the conversion rate is 5%.
The click-through rate, or we call it CTR in short, shows the percentage of user clicks. It could be the clicks on a specific link or CTA out of the total users who view it. It's a good metric for understanding how compelling your CTAs are. CTR and conversion rate are very closely related, in fact they mean the same in many cases.
For example, you're testing two different CTAs on a product page. If the CTA in version A gets clicked more often, it has a higher CTR.
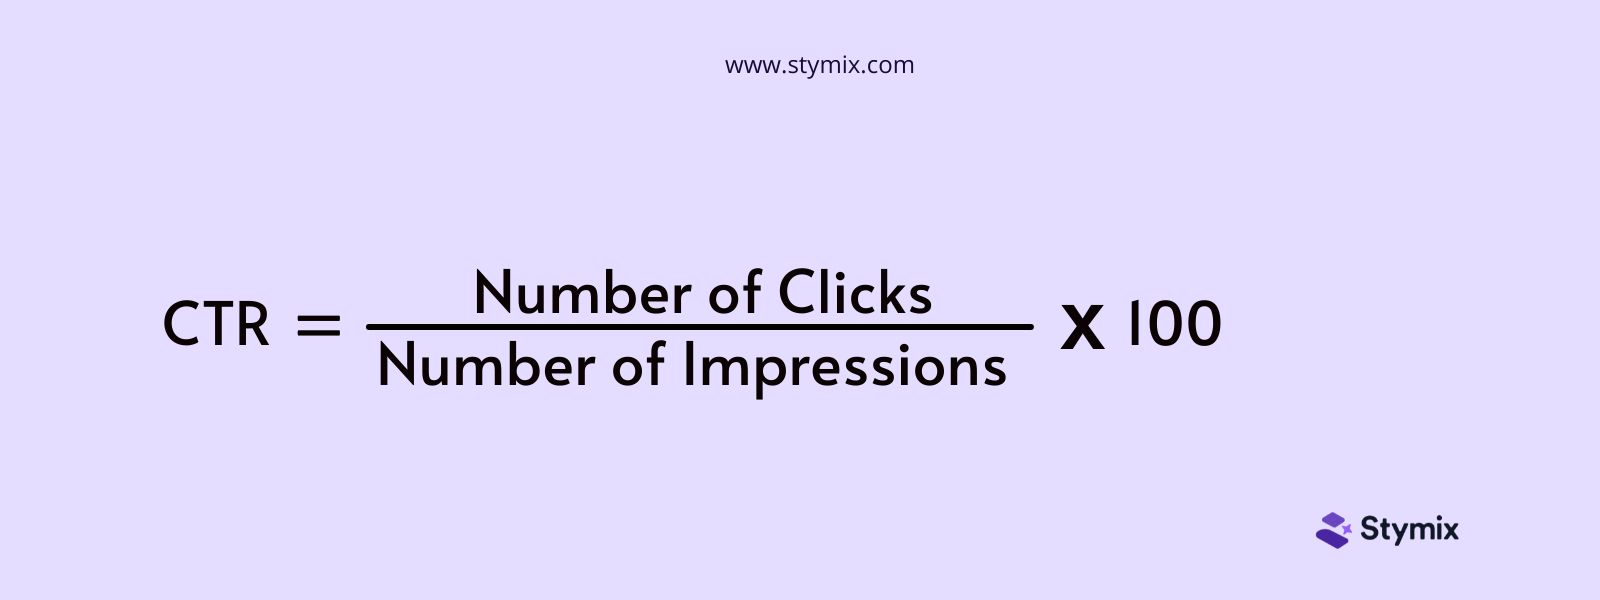
Here's how we can calculate CTR:
CTR = (Number of Clicks/Number of Impressions) x 100
Like the conversion rate of a landing page, CTR is one of the valuable stats you should watch to track performance.
Following some tips may help you make your CTR stand out and encourage people to click it. For example:
Bounce rate is another popular and useful metric. It shows the percentage of users who leave a website after viewing only one page. When your site has a high bounce rate, it means your page isn't engaging or relevant enough. This metric can be used as primary, secondary, or even diagnostic metric in the test.
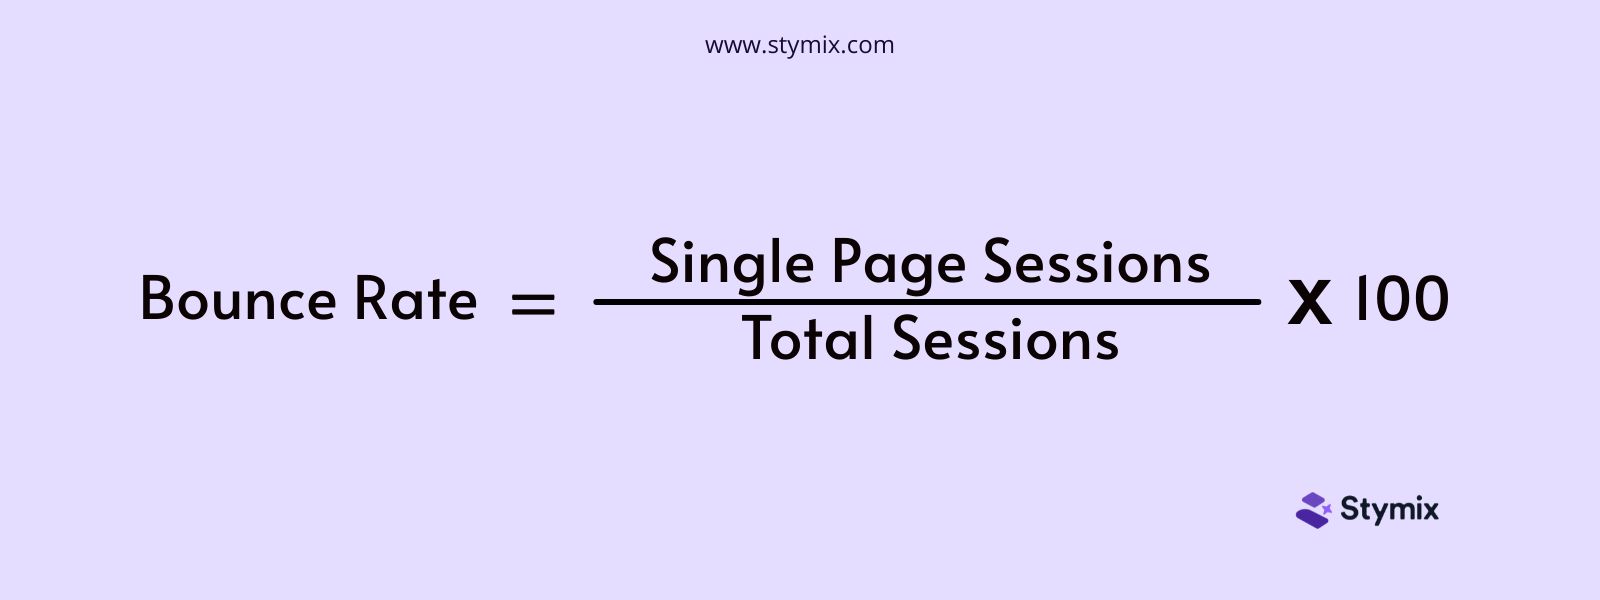
Bounce Rate = (Single Page Sessions / Total Sessions) x 100
Single Page Sessions means the number of sessions where visitors viewed only one page. While Total Sessions means the total number of sessions on your site.
The more you can reduce the bounce rate, the more you can engage your visitors. So, you need to reduce the bounce rate as much as you can.
Scroll depth measures how far down a webpage visitors scroll. This metric is relatively very clear and closely connected to bounce rate. It helps you understand how much of your content visitors are actually viewing.
A good scroll depth rate usually falls between 60-80%. It's a great metric that can help you determine the effectiveness of your site length and content.

Scroll Depth = (Maximum depth scrolled / Total height of the page) x 100
Available tools usually provide the scroll depth directly to you.
It's the percentage of users who have revisited your site after their first visit. This metric helps you understand how well your site encourages visitors to return.
For example, you're testing a new feature on your website. If more users who experience the new feature return to your site compared to those who don't, it means the new feature is effective.
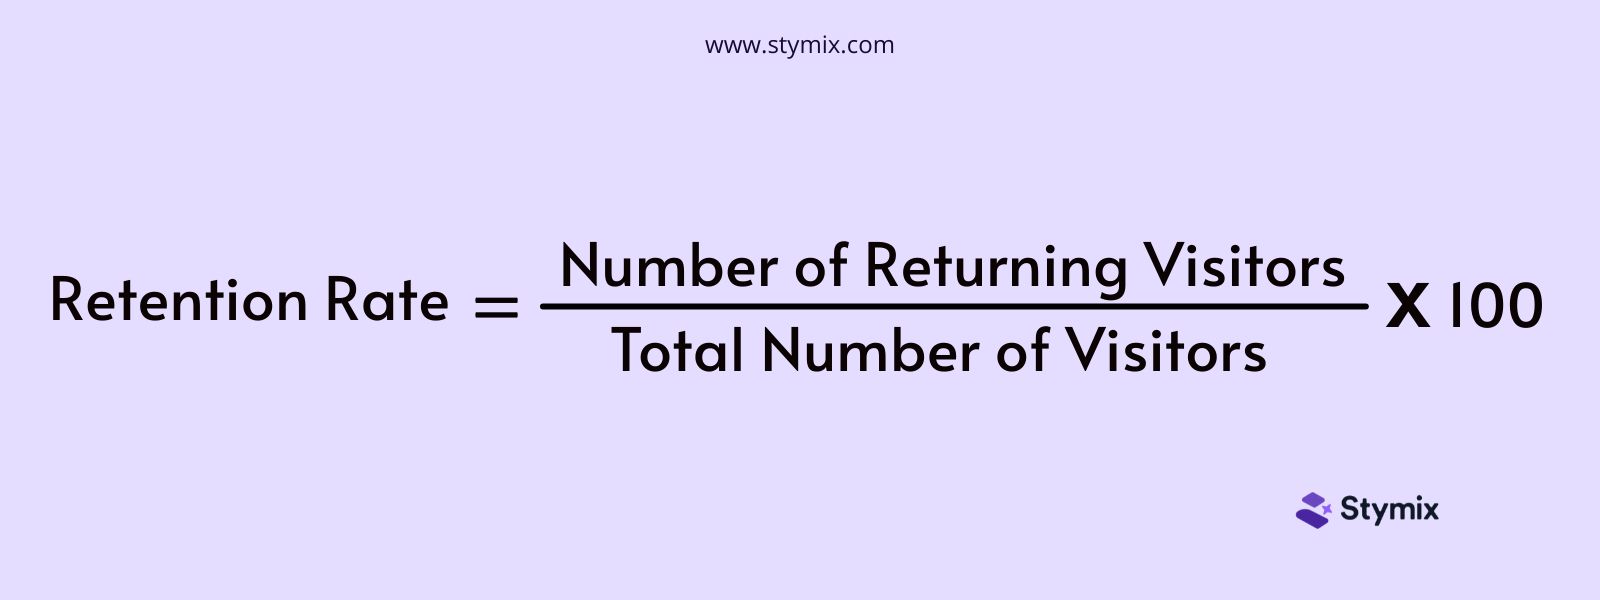
Retention Rate = (Number of Returning Visitors / Total Number of Visitors) x 100
The abandonment rate shows how many people started taking an action on your website but left without finishing it. For example, they might add items to their shopping cart but then leave without buying anything. Or they may start filling up a form to sign-up but leave it halfway.
This metric is important for identifying friction points in your user experience. Let's say you're testing two versions of a sign-up form. If more users abandon version A halfway through, it might be lengthy or irrelevant. So you know where to work on.
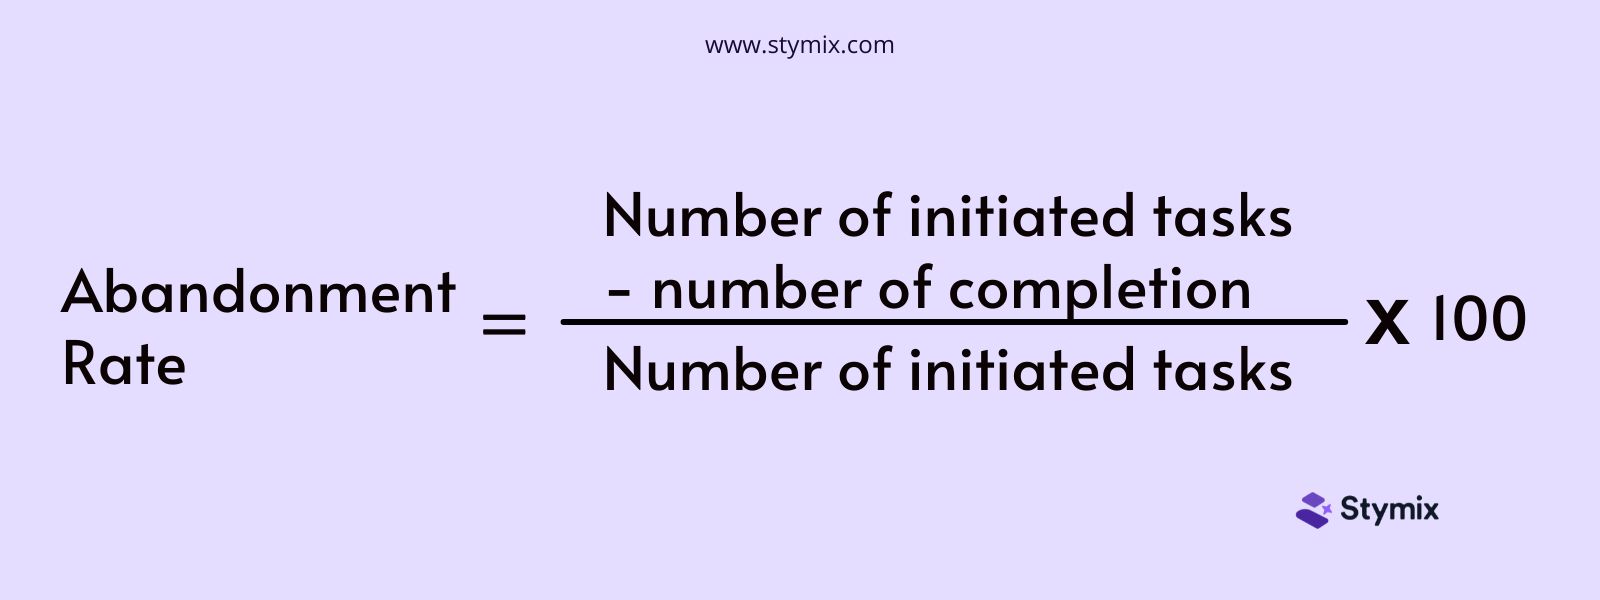
Abandonment Rate = (Number of initiated tasks - number of completion /Number of initiated tasks)×100
Average time on page refers to the duration visitors spend on a specific page. You get insights into how engaging your content is through this metric. It also provides info on how effectively it captures and holds users' attention.
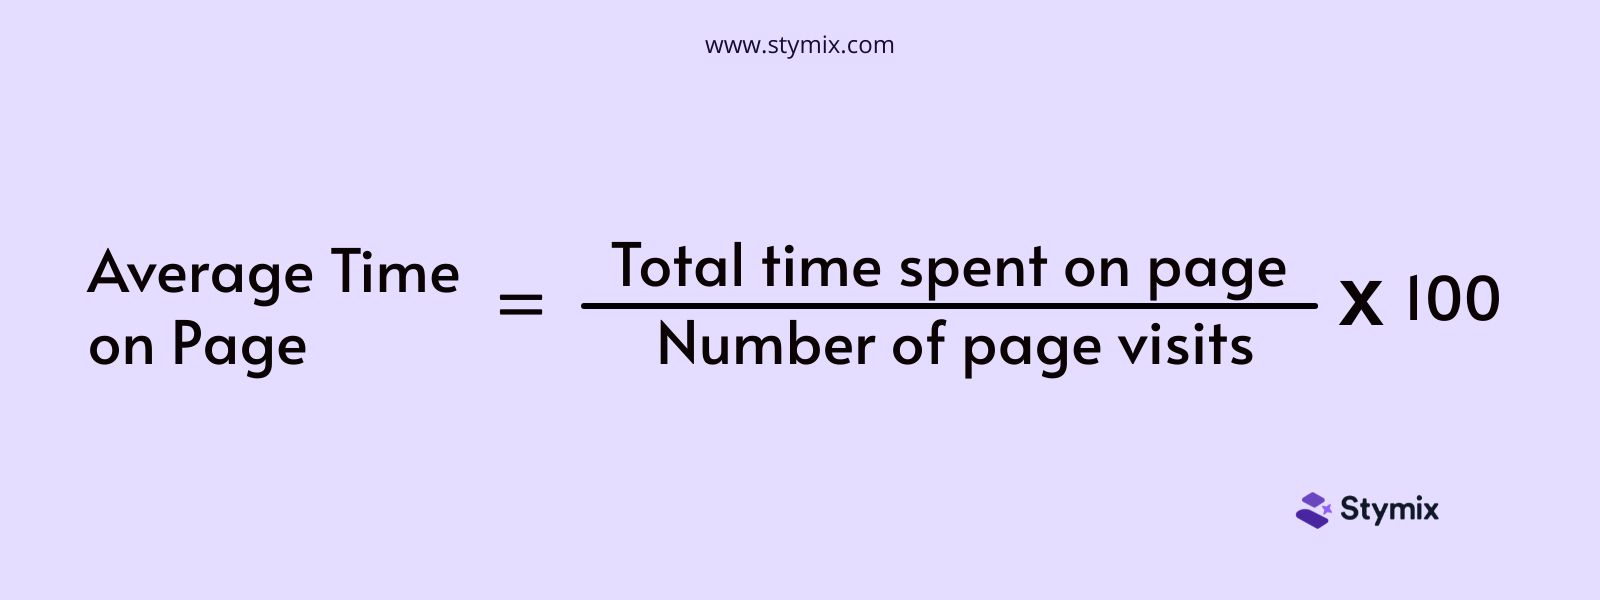
To calculate the average time on a page, we sum up the total time all users spend on a page and divide it by the number of visits to that page. All tools actually give this value directly so you don't need to calculate it separately.
Average Time on Page= Total time spent on page/Number of page visits
AOV is the amount that a customer typically spends when placing an order on your website. This one helps you understand the monetary impact of your changes and how they affect customer spending. This metric is more common and very important for e-commerce pages.
You're testing different product bundles on your e-commerce site. Version A offers a bundle with a slight discount, while version B offers a premium bundle with added features. If version B leads to higher average spending per purchase, it has a higher AOV.
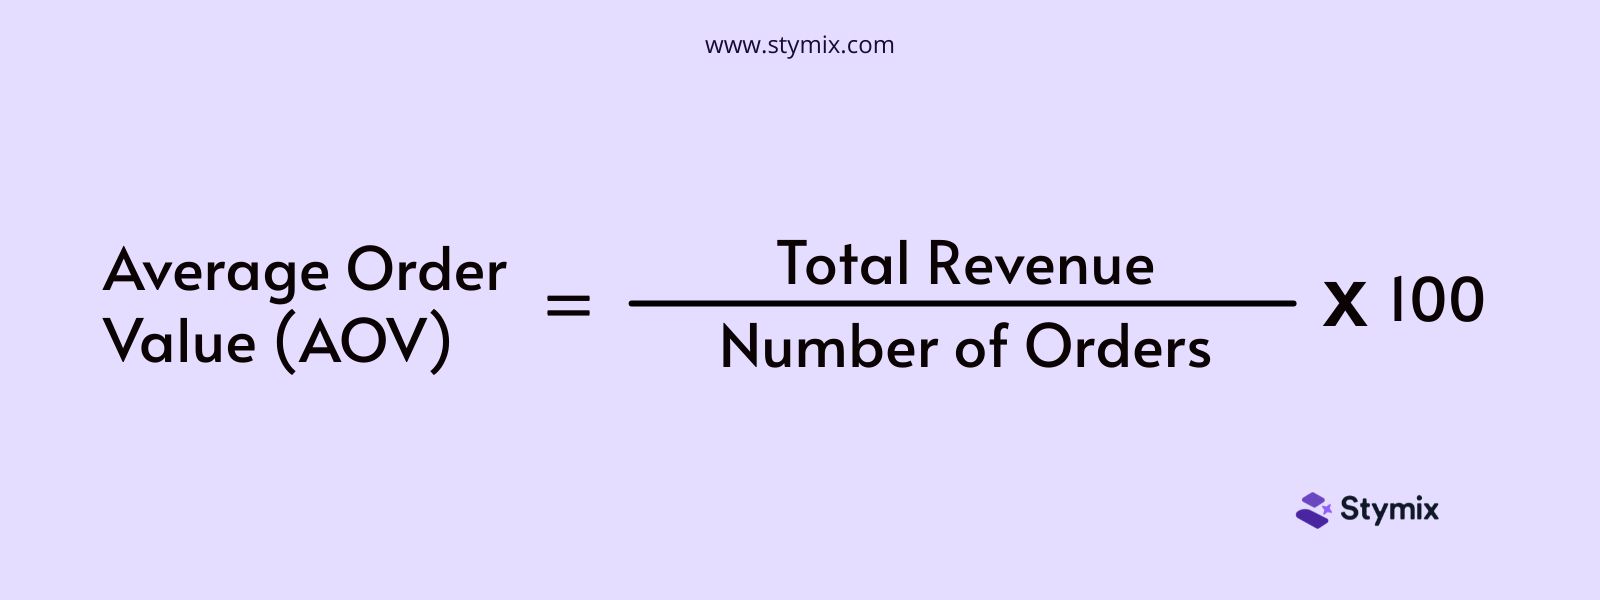
AOV = Total Revenue / Number of Orders
The churn rate measures how many customers stop using your product or service over a time period. It helps you understand how many people you're losing compared to how many you started with.
Suppose you start with 1,000 customers this month. By the end of the month, 100 customers decide to stop using your service. Your churn rate would be 10% for that month.
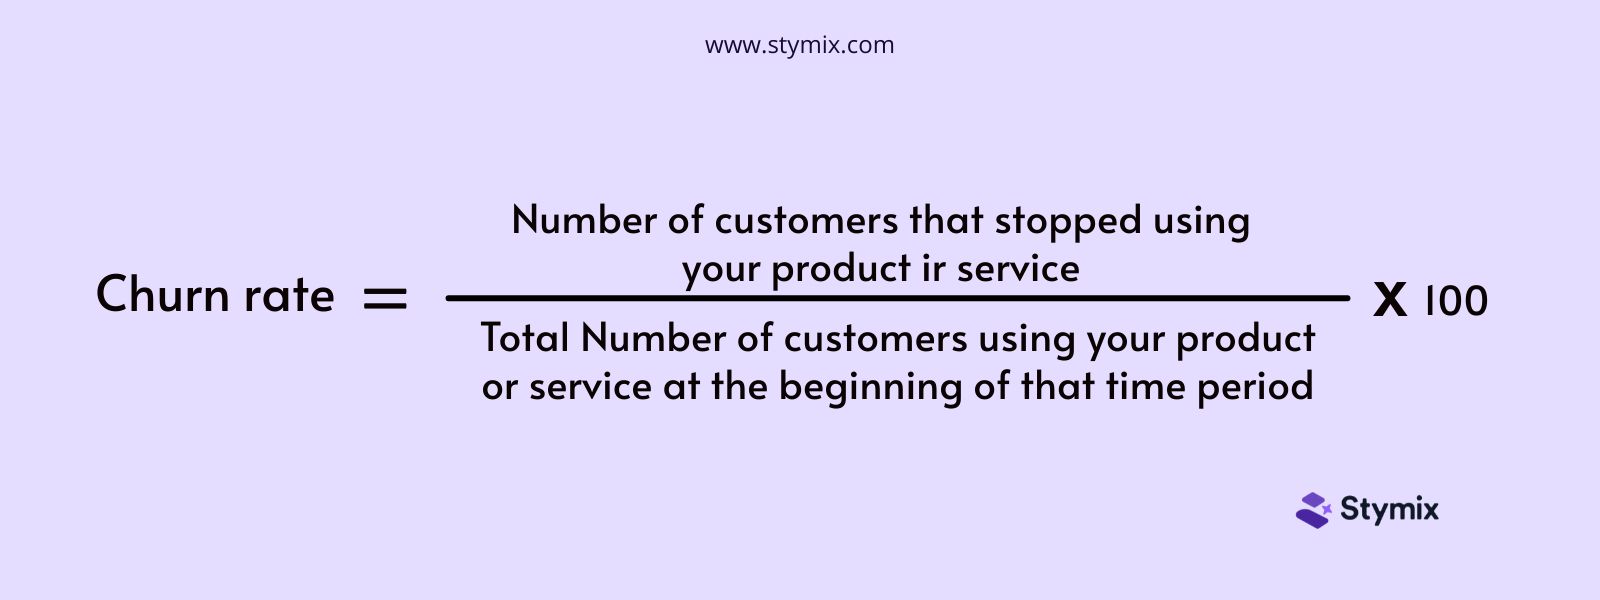
Churn rate = (Number of customers that stopped using your product or service/ Total Number of customers using your product or service at the beginning of that time period) X 100
Another common and probably the most important metric you should track when A/B testing is revenue. A/B tests that measure revenue show you clearly how your changes affect your bottom line.
When you track revenue, you're measuring how much money your changes actually make for your business. People often look at revenue alongside other metrics like AOV, conversion rates, and abandonment rates.
Revenue also helps you understand how people buy things and which messages work best. However, it's important to be cautious when linking revenue changes directly to specific A/B tests.


Choosing the right A/B testing metrics is like picking the best tools for a job—it depends on what you want to achieve. Here's how to decide which metrics to focus on:
To begin with, define your goal. Your goals will guide your metric selection, whether it's increasing sales or reducing bounce rate.
Choose metrics that align closely with your business goals. For instance, metrics like conversion rate or average order value (AOV) will be useful if you aim to boost revenue.
Consider metrics that reflect how users interact with your site. Metrics like scroll depth or average time on page can reveal whether users find your content engaging. These are great as diagnostic metrics.
Select metrics that directly measure the impact of your changes. This could be revenue generated, conversion rates, or retention rates, depending on what you're testing.
Opt for metrics that provide actionable insights. For example, a high bounce rate might improve page load times or content relevance.
Focus on a few key metrics that provide the most meaningful information. This ensures you can interpret results effectively and make informed decisions.
A/B testing is about learning and refining. Be open to adjusting your metrics based on what you learn from your tests to achieve better results.
So there you have it—10 common metrics for A/B testing. Mastering these metrics is like having a compass for navigating your website's success. You can fine-tune your strategies by understanding how they work to better meet your goals. So, start experimenting, keep learning from your data, and talk to us for any help.